It’s no secret I’m a big fan of working with Docker on a local developer environment. The ability to quickly spin up a project and spin it down, the lack of 18 versions of solr running in conflict, the way docker just thrashes my concept of “I have plenty of Hard Drive to work”… It’s magical. With all that, we still need to maintain a sense of parity between the non-docker and the on-docker developer experience. That includes things like deploying files, browsing the site and debugging.

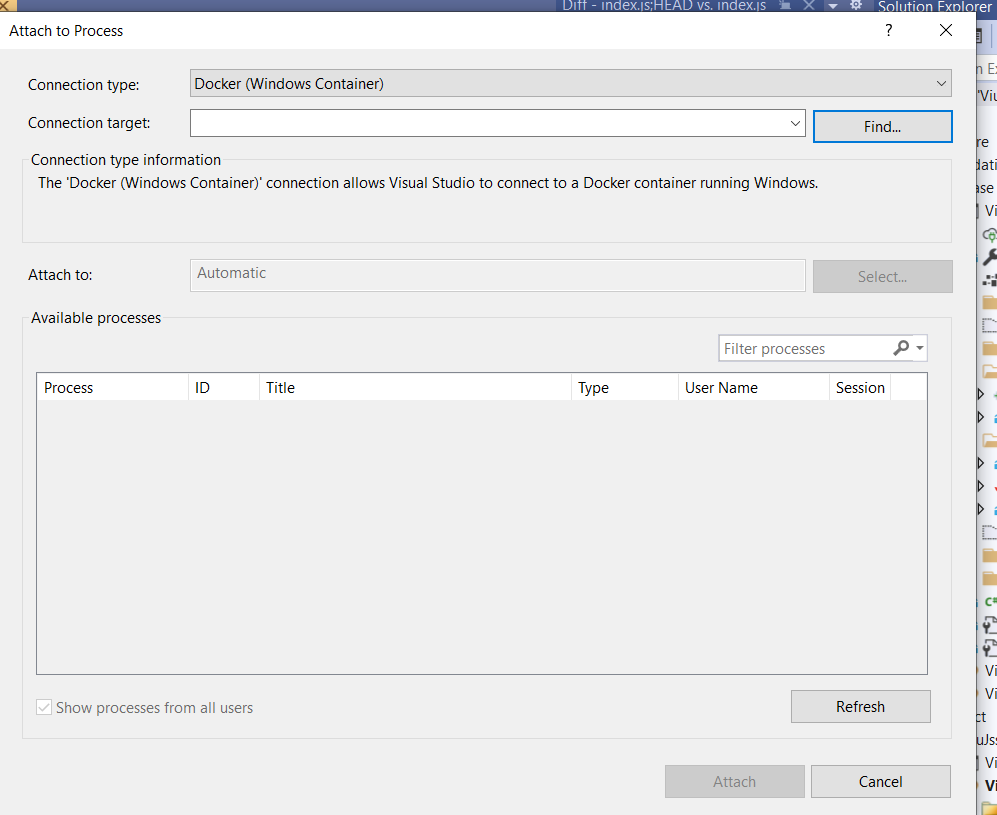
One of the developers on our team was having an issue with debugging. It was something I’d not seen before, and frankly, there wasn’t anything easily google-able on the web. And my google-fu is usually pretty strong. This developer was seeing the following screen when trying to attach the debugger to the container:

The weird part about this was that they could see the containers using the “Find” button, but no processes would show up. There were no errors, warnings or other symptoms that would help solve the conundrum. (SAT word, kids!) I took to slack (you should go there) for some assistance. The first response from Aaron was pretty spot on: It looks like the remote debugger wasn’t running. Why? It turns out that when you attach the debugger to a container, the container is instructed to download the remote debugger. If you’ve got something in the way of your TLS handshake, this might fail. That’s exactly what was happening. Once we disabled the ZScaler, the remote debugger was downloaded and we are able to see the processes! Thanks to Maarten for this tip. There was also an alternative approach proposed that would include you downloading the remote debugger and mounting it into the container’s file system. This would circumvent the issue entirely.
Happy Debugging!
